|
Stephen Burch's Birding & Dragonfly Website |
|
Home | Trip Reports | Gallery | UK index | Oxon pics | UK pics | Dragonflies | Other Nature | Links |
||
|
Stephen Burch's Birding & Dragonfly Website |
|
Home | Trip Reports | Gallery | UK index | Oxon pics | UK pics | Dragonflies | Other Nature | Links |
||
Contents of this page
Introduction The results shown below are intended to make it easier to compare the results obtained for all the different cameras and to examine the effects of using up to 3 different raw converters on the same image files:
I should perhaps restate here than when using all raw converters, I made sure to turn off all parameters that could potentially affect the noise level of the resulting images. This included all noise reduction and sharpening parameters both on the camera and in the raw converters. In addition, I turn off any optics settings such as correction for lens profiles and chromatic aberrations. For the previous measurements, I showed how the noise levels varied as a function of image grey level, which required a large number of values to be derived for each image. In nearly all cases, the results shown "hump" shaped curves, with the maximum noise level occurring at intermediate grey levels, with lower values occurring in the darker and lighter regions of the images - see for example this plot:
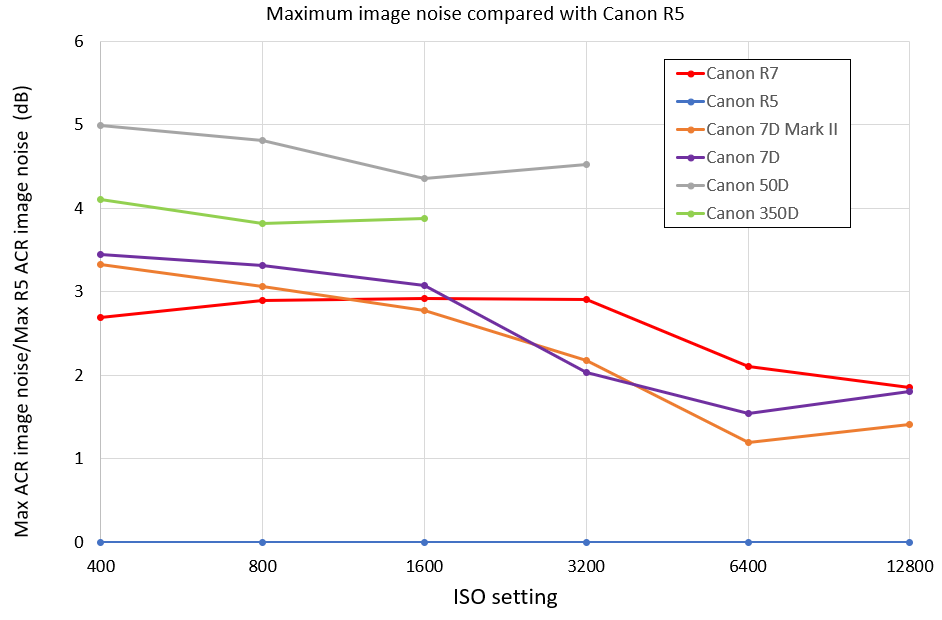
Given the above results, it seemed appropriate to reduce the measurements to a single value for each image - namely the maximum noise level (standard deviation). The advantage of this approach was that (a) it simplifies looking at the key trends shown by the measurements and (b) was much quicker to do! So below I show results for the maximum noise level or standard deviation in each image, which generally occurred for intermediate grey levels as shown above. Shape of above curves I am now pretty sure that the explanation for this is that the raw converters do not generate image grey levels that are directly proportional to the incident light intensity. Instead, an inverse gamma correction is applied to the digitised values from the sensor itself. It is this correction, combined with the noise characteristics of the sensor values themselves, that produces these hump shaped curves. For proof that the raw sensor values are themselves linearly proportional to incident light intensity, see here. Results using ACR As it is third party software, ACR might be expected to give a closer representation of the actual raw sensor values prior to de-mosaicing of the Bayer mask than Canon's own DPP software, where camera specific processing might well be applied. The plot below shows my results for the maximum image noise level (standard deviation) for 8-bit equivalent images for 6 different Canon cameras, as a function of ISO setting. Note each axis is shown on a logarithmic scale (log base 2). In general, if the predominant form of noise on these images is due to photon counting statistics, then the noise levels are expected to increase by the square root of two for each factor of two increase in the ISO value. This is a factor 1.4 for a 1 stop increase in ISO, or equivalently 3 dB. On the log-log plot shown below, a straight line variation with ISO is expected, with a gradient of 0.5.
The measured maximum noise levels from six cameras, following ACR raw conversion, as a function of ISO setting The measurements shown above agree quite well with this expectation, with the mean gradients of the results for each camera on a log-log plot being close to the expected 0.5. There are some minor differences for particular ISO settings, but generally the results for the different cameras form approximately parallel straight lines on the above plot. The graph below shows the same results, but plotted as the differences from the Canon R5 values, in dB. This shows more clearly the magnitudes of the differences between the cameras, as a function of ISO setting. Generally the camera to camera differences are reasonably constant for all ISO settings, although the difference between the R5 and the R7, 7D mk II and 7D decrease from about 3dB to about 2dB at the highest ISO values. Brief note on decibels (dB) dB = 20 log10(A1/A2). If A1 is twice the value of A2, there is a +6dB difference between them. Now noise due to photon counting statistics is expected to increase by the square root of two, or 1.4, for each factor two increase in exposure (or signal). A factor 1.4 corresponds to a 3dB difference. Hence a 3dB difference in noise level corresponds to a factor change in exposure (or ISO), i.e. a full stop difference
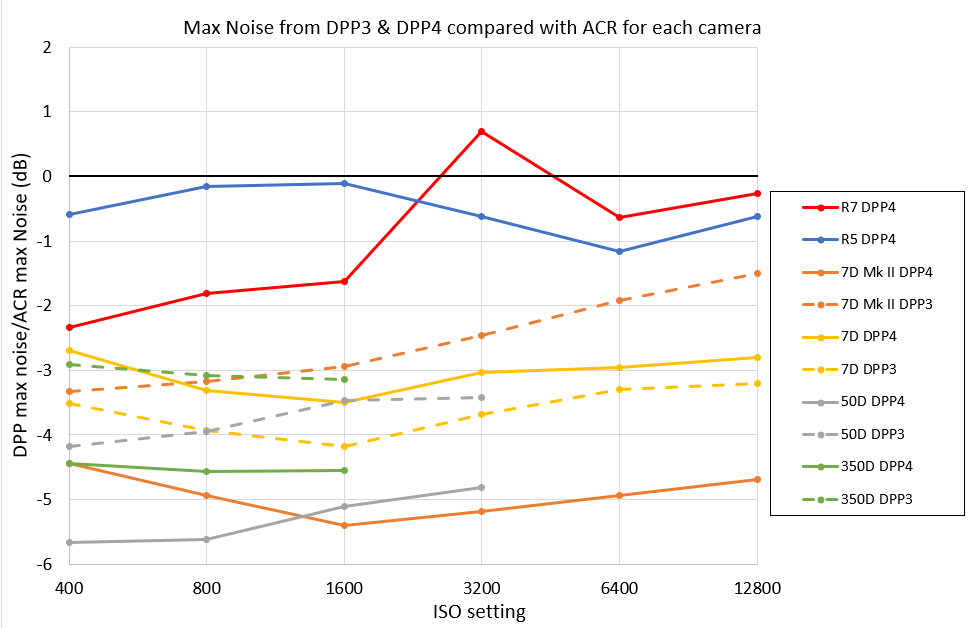
Differences in dB between the Canon R5's maximum noise levels and those from five other cameras, following ACR raw conversion, as a function of ISO setting Discussion From the plots above, the new mirror-less Canon R5 shows the best noise performance (lowest maximum values). On average the R5 values are about 2dB or 2/3 stop better than those from the older DSLRs and the Canon R7. For the R5, the sensor pixel pitch (4.39µm) is slightly larger than that of the much older Canon 7DmkII (4.09μm). However the difference between the R5 and the 7DmkII is not very large - about 2/3 stop on average. This means that, for example, the noise level on an ISO 6400 R5 image would be similar to, or slightly larger than a 7DmkII image with ISO 3200. The most recently launched camera shown above is the mirror-less Canon R7, which has a pixel pitch of 3.2 μm, i.e. much smaller than the R5 and slightly smaller than the 7DmkII. It is perhaps disappointing that the developments in sensor technology between 2014 (7DmkII launch date) and 2022 (R7 launch date) do not appear to have led to a larger reduction in noise level, by improved detection efficiency. Brief summary Following on from the ACR results shown above, I also looked at the noise levels obtained with the raw converters from Canon, available in their Digital Photo Professional software, both versions 3 (DPP3) and the newer version 4 (DPP4). Note that DPP3 is not applicable to the newer Canon mirrorless cameras, including the R5 and R7. The plot below shows the results for maximum noise level obtained with DPP4 and, where applicable, DPP3, compared with those from the Canon R5, processed using ACR. To make this comparison clearer, I am showing the differences from the corresponding ACR values for each camera in decibels (dBs). Hence for each camera, this plot shows the differences in noise levels from ACR, DPP4 and DPP3.
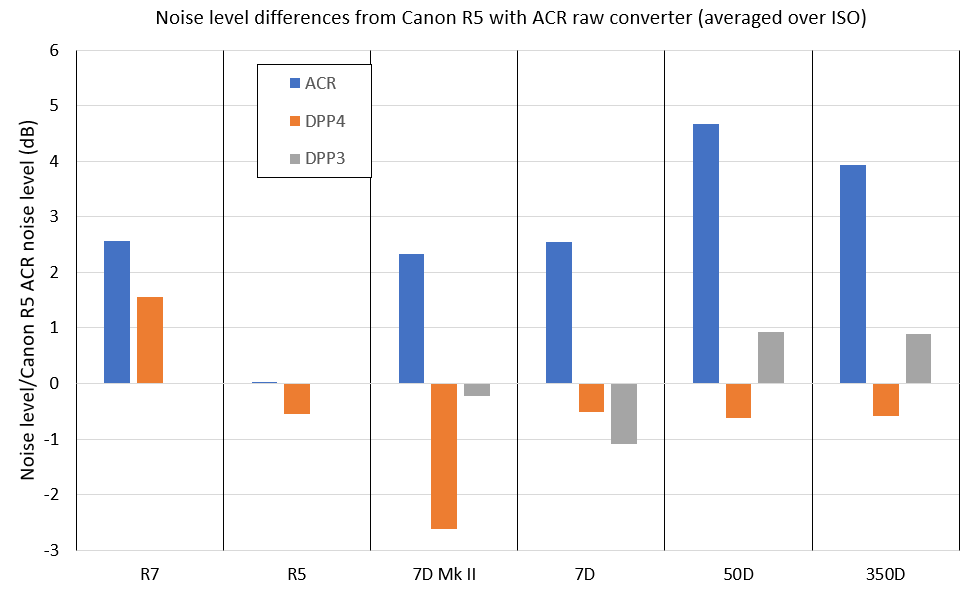
Maximum noise levels obtained with DPP4 and DPP3, shown as differences in dBs from the corresponding ACR values for each camera separately. The plot above shows that the choice of raw converter has a large effect on the noise levels obtained in the resulting images. Relative to ACR, the DPP noise levels range from about 0dB for the R5, down to an incredible -5 to -6dB (two full ISO stops) less for the 7D Mk II with DPP4 and the 50D again with DPP4. There are also quite large differences between the noise levels with DPP3 and DPP4. For example, with the 7D Mk II, DPP3 gives, on average, noise levels that are between about +2dB and +3dBhigher than with DPP4. Relative to ACR, DPP4 gives lower noise levels for the older DLSR cameras but about the same noise levels for the R5 and R7 (both less than 1 dB average difference). Most of the above differences are reasonably constant with ISO setting, so averaging the differences over all ISO settings can be used to provide a simpler summary of the results given in the above two plots, as shown below:
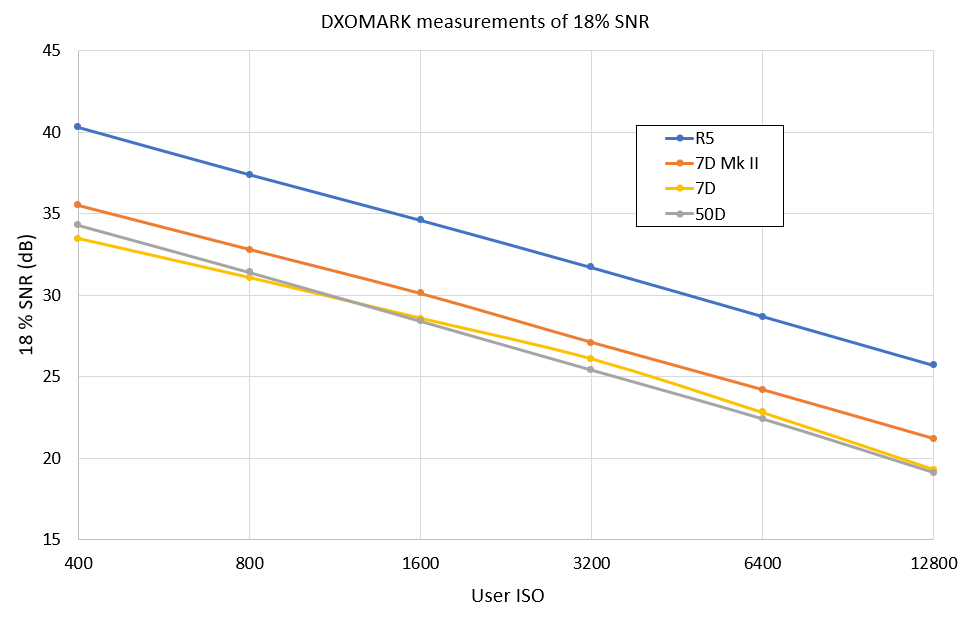
Differences in dB from the Canon R5 noise levels for different cameras and raw converters, averaged over ISO setting The plot above shows differences in dB, relative to the R5 ACR values, for the noise levels from the different cameras and raw converters. Discussion However, with DPP4, substantially different noise levels were obtained, with for example the 7D Mk II having 2.5dB lower noise values than ACR for the R5, whereas with DPP3 the noise was over 2dB higher than with DPP4. There was a tendency for DPP4 to give lower noise levels than with DPP3, but not for the 7D where DPP3 gives slightly lower values than DPP4, by about 0.5 dB on average. This is all very odd, and difficult to account for on physical grounds. It seems that there are hidden parameters in the raw converters, especially DPP4, that affect the noise levels obtained on the output images. One can speculate that some spatial averaging is being applied to a greater extent with some raw converters than others. This spatial averaging may have an effect on the image sharpness as the easiest way of reducing noise to do some spatial averaging. It appears that the Canon raw converters DPP3 and DPP4 are more prone to use different camera specific processing parameters than ACR. DXOMARK is an organisation that performs independent assessments/tests on photographic equipment. Importantly, DXOMARK state that their measurements are made from the raw sensor data, i.e. before any de-mosaicing and other processing performed by a raw converter. As we have seen above, it appears the properties of the raw converter used can have a significant effect on the camera image noise levels. Of the various parameters DXOMARK give for camera sensors, the one with most relevance here are their measurements of what they call 18% SNR. This I take to mean the signal-to-noise ratio (SNR), as measured at a grey level of 18% brightness, which typically corresponds to mid-grey. A description of their measurement procedures is given on their website, but some details are not fully defined nor explained as far as I can tell. For example, it is not clear exactly how the grey level corresponding to 18% is determined for an image. In addition, it is not completely clear how their measurements of the individual noise levels in the red, green and blue channels are combined to provide a single value. I'd also be interested to know how their green channel is defined as typical Bayer masks on camera sensors have two green pixels. Are these averaged in some way to provide the green channel information? It does however appear that the DXOMARK measurements are made very rigorously using optimised and specialised (transmission) test charts and analysis methods, so they should provide objective and accurate measurements of the parameters measured. But I am not aware of any other sources of this type of information, so there is nothing to cross check these measurements against. Results
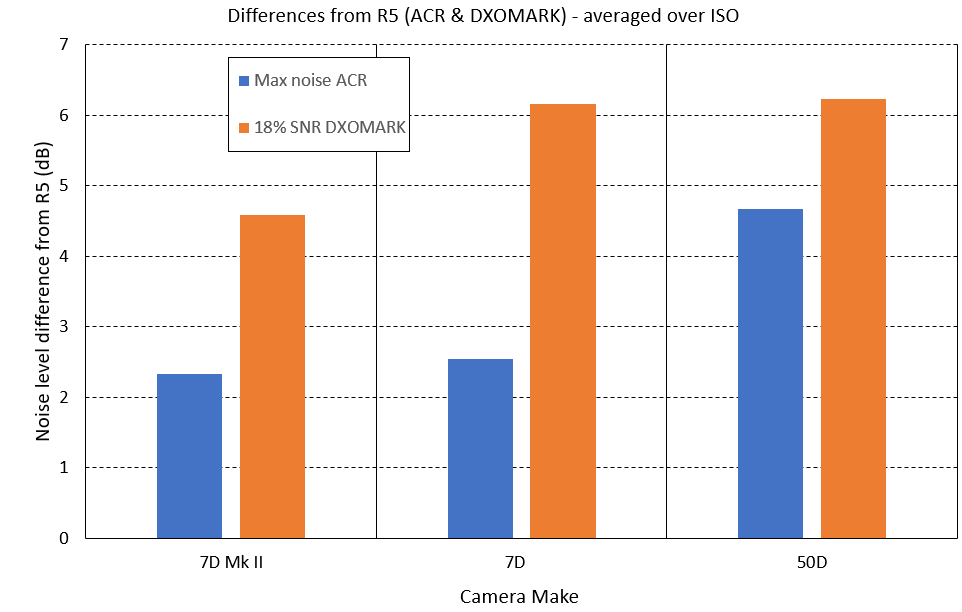
DXOMARK measurements of 18% SNR for four Canon cameras The DXOMARK measurements above are broadly in-line with my results for the maximum noise in each image, processed using ACR, in that the lowest noise (highest SNR) is obtained with the R5, with the older DSLRs all providing similar noise levels to one another that are above the R5 (or below in SNR terms). A more exact comparison of my measurements with those provided by DXOMARK is given below. Here I show the differences from the corresponding R5 values, averaged over the ISO setting. Note that I have inverted the differences for the SNR values so that they are in the same sense as my noise level measurements (i.e. higher relative noise levels are positive).
Differences between the R5 noise levels and those from three other cameras, as measured from images converted using ACR and those prior to raw conversion from DXOMARK. Discussion Put another way, on average my measurements for the R5 were about 2-3 dB poorer, relative to these other 3 cameras, than the R5 DXOMARK measurements. But as my measurements were of a different parameter (max noise on raw converted images) from that given by DXOMARK (18% SNR measured from raw sensor data before raw conversion, it is not possible to make direct comparisons. Summary
|
Home | Trip Reports | Gallery | UK index | Oxon pics | UK pics | Dragonflies | Other Nature | Links |